


10-14
Cisco Prime Network 4.0 User Guide
OL-29343-01
Chapter 10 Working with Reports
Report Categories
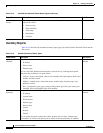
Most
Common
Daily Events
For each day in the specified time period:
• Specified number of most common tickets, service events, syslogs, and traps
• Number of each type of ticket, service event, syslog, and trap
• If selected, a pie chart presenting the events by percentage in a graphical format
Fault Database
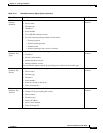
Most
Common
Syslogs
Most common syslog messages and the number of each for the specified time period and
devices.
A pie chart presents the information by syslog message and percentage in a graphical format.
Fault Database
Syslog
Count
Number of syslog messages by type for the specified time period with the times of the first
and last occurrences.
A pie chart presents the information by syslog message and percentage in a graphical format.
Fault Database
Syslog
Count (By
Device)
For each device, the type and number of each syslog message and the times of the first and
last occurrences for each type.
A pie chart presents the information by device and percentage in a graphical format.
Fault Database
Syslog
Trend (By
Severity)
For the specified devices, the trend of specified syslog messages in graph format:
• By priority
• For the specified time period
• At the specified intervals
Fault Database
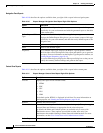
Table 10-12 Standard Events Report Types (continued)
Report Name Description Data Source