


10-5
Cisco Prime Network 4.0 User Guide
OL-29343-01
Chapter 10 Working with Reports
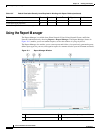
Using the Report Manager
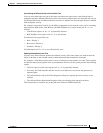
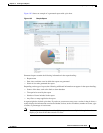
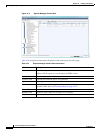
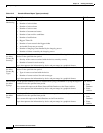
Figure 10-2 shows an example of a generated report with a pie chart.
Figure 10-2 Sample Report
Generated reports contain the following information in the report heading:
• Report name
• Date, time, and time zone in which the report was generated
• Name of user who generated the report
Depending on the type of report, the following additional information can appear in the report heading:
• Source of the data, such as the fault or alarm database
• Time period covered by the report
• Number of items included in the report
• Any filters or maps applied to the report
A report might also include a pie chart. If you hover your mouse cursor over a section in the pie chart, a
tooltip displays the information associated with that section, such as IP address, number of events, type
of event, or percentage of total events.
Note Not all reports include pie charts. In addition, reports that normally include a pie chart do not
display a pie chart if the chart exceeds 25 slices.