


Send documentation comments to mdsfeedback-doc@cisco.com.
5-3
Cisco MDS 9000 Family Fabric Manager Configuration Guide
OL-6965-03, Cisco MDS SAN-OS Release 2.x
Chapter 5 Fabric Manager Web Services
Fabric Manager Web Services Overview
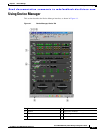
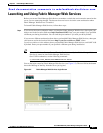
Events
The Events tab shows events and issues for the selected items, persistent across user sessions.
The Events tab contains the following subtabs:
• Summary—Shows a summary of events and problems for All SANs, or a selected SAN, fabric, or
switch. You can click on any of the blue links for more information about that item.
• Fabric—Shows a detailed list of events and hardware, or accounting. You can filter these events by
severity, date, and type of event.
• Syslog—Shows a detailed list of system messages. You can filter these events by severity, date, and
type of event.
Performance
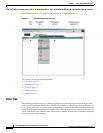
The Performance tab shows an overview of the average throughput and link utilization of SAN
components. You see pie charts for the throughput and utilization. You can click on a pie chart to view
a table of the data. In these tables, clicking on a blue link will display a graph of that data, if applicable.
The Filter drop-down menu at the top right of the screen allows you to filter the data based on various
periods of time.
The Performance tab contains the following subtabs:
• Summary—Shows the total utilization and throughput in summary form.
• Snapshots—Creates a snapshot of the historical performance at the time you generate the report.
• End Devices—Shows a detailed list of end device (host or storage) port traffic and errors.
• ISLs—Shows a detailed list of ISL traffic and errors.
• Flows —Shows a detailed list of host-to-storage traffic.
• Traffic Analyzer—Shows a summary of SPAN ports configured in the SAN and any Traffic
Analyzers configured.
Note Performance Manager shows statistics for fabrics that you have configured collections for using the
Collection Wizard. See the “Historical Performance Monitoring” section on page 33-2.
Inventory
The Inventory tab shows an inventory of the selected SAN, fabric, or switch. You can export this
information to an ASCII file in comma-separated value format, that can be read by applications such as
Microsoft Excel. You can set the number of rows and columns per page.
The Inventory tab contains the following subtabs:
• Summary—Shows VSANs, switches, ISLs, and ports.
• VSANs—Shows details about VSANs.
• Licenses—Shows details about the licenses in use in the fabric.
• Modules—Shows details for MDS switching and services modules, fans, and power supplies.
• End Devices—Shows the host and storage ports.