


Send documentation comments to mdsfeedback-doc@cisco.com.
33-5
Cisco MDS 9000 Family Fabric Manager Configuration Guide
OL-6965-03, Cisco MDS SAN-OS Release 2.x
Chapter 33 Performance Monitoring
Historical Performance Monitoring
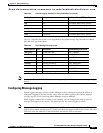
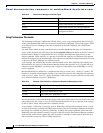
Table 33-4 shows two examples of 1-Gigabit links with different averages in our example collection and
at what traffic measurements the Warning and Critical events are sent.
Set these thresholds on the last screen of the Collections Configuration Wizard by checking the Send
events if traffic exceeds threshold check box.
Using the Performance Manager Configuration Wizard
To create a collection using the Performance Manager Configuration Wizard in Fabric Manager, follow
these steps:
Step 1 Choose Performance > Create Collection to launch the Performance Manager Configuration Wizard.
Step 2 Choose the VSANs from which you want to collect data or choose All to collect statistics across all
VSANs in the fabric.
Step 3 Check the Type check boxes for each type of links flow or SAN element that you want included in your
collection.
Step 4 If you want to ignore flows with zero counter values, check that check box.
Step 5 If you are using Cisco Traffic Analyzer, enter the URL where it is located on your network.
Step 6 Click Next to review the collection specification data. Remove any links, flows, or SAN elements you
are not interested in.
Step 7 Click Next to configure other collection options.
Step 8 Check the appropriate check boxes if you want to include errors and discards in your collection, and if
you want to interpolate data for missing statistics.
Step 9 Check the Send event if traffic exceeds threshold check box if you want to configure threshold events
as explained in the “Using Performance Thresholds” section on page 33-4.
Step 10 Click the Use absolute values radio button if you want absolute value thresholds or click the Baseline
values over radio button if you want baseline thresholds.
Step 11 Choose the time window for baseline calculations if baseline thresholds are configured.
Step 12 Choose the Critical and Warning threshold values as a percent of link capacity (for absolute value
thresholds ) or average (for baseline thresholds).
Step 13 Click Finish to create the collection configuration file. You see a dialog box asking if you want to restart
Performance Manager.
Step 14 Click Yes to restart Performance Manager to use this new configuration file, or click No to exit the
Performance Manager Configuration Wizard without restarting Performance Manager. If you choose
No, Performance Manager will not use the new configuration file until you restart it by choosing
Performance Manager > Collector > Restart.
Table 33-4 Example of Events Generated for 1-Gigabit Links
Average Warning Event Sent at 150% Critical Event Sent at 200%
400 Mbps 600 Mbps 800 Mbps
200 Mbps 300 Mbps 400 Mbps