


Send documentation comments to mdsfeedback-doc@cisco.com.
32-3
Cisco MDS 9000 Family Fabric Manager Configuration Guide
OL-6965-03, Cisco MDS SAN-OS Release 2.x
Chapter 32 Network Monitoring
SAN Discovery and Topology Mapping
Mapping Multiple Fabrics
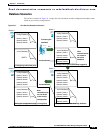
To log into multiple fabrics, the same username and password must be used. The information for both
fabrics is displayed, with no need to select a seed switch. To see details of a fabric, click the tab for that
fabric at the bottom of the Fabric pane, or double-click the fabric’s cloud icon.
When you quit the Fabric Manager client, you can have Fabric Manager Server continuously monitor
that fabric. Alternatively, you can use Fabric Manager client to select a fabric to monitor.
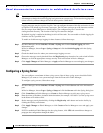
To continuously monitor a fabric in Fabric Manager, follow these steps:
Step 1 Choose Server > Admin. You see the Server Admin dialog box with a list of fabrics.
Step 2 Check the Continuously Monitor check box next to the fabric(s) you want Fabric Manager Server to
monitor.
Step 3 Click Apply.
The Continuously Monitor feature requires the purchase of the Fabric Manager Server license package.
If you have not purchased and installed this package, you see a pop-up window informing you that you
are about to enable a demo license for this feature. Click Ye s to enable the demo license.
Note When you are finished checking out the demo, you can “check in” the feature by clicking the
Check In FM button as described in the “Fabric Manager Server Licensing” section on
page 9-13.
Step 4 Click Close to close the Server Admin dialog box.
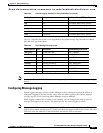
Inventory Management
The Information pane in Fabric Manager shows inventory, configuration, and status information for all
switches, links, and hosts in the fabric. Inventory management includes vendor name and model, and
software or firmware versions. Select a fabric or VSAN from the Logical Domains pane, and then select
the Summary tab in the Information pane to get a count of the number of VSANS, switches, hosts, and
storage elements in the fabric. See the “Using Fabric Manager Client” section on page 3-3 for more
information on the Fabric Manager user interface.
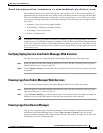
Using the Inventory Tab from Fabric Manager Web Services
If you have configured Fabric Manager Web Services, you can launch this application and access the
Inventory tab to see a summary of the fabrics managed by the Fabric Manager Server. The Inventory tab
shows an inventory of the selected SAN, fabric, or switch.
• Summary—Shows all VSANs, switches, and ports in the selected SAN or fabric.
• VSANs— Shows all VSANs in the selected SAN or fabric.
• Switches—Shows all attributes (such as IP address, vendor, and model) for all switches in the
selected SAN, fabric, or VSAN.
• Licenses—Shows details about the licenses in use in the fabric.
• Modules—Shows all line cards, fans, and power supplies for all switches in the selected SAN,
fabric, or VSAN.