


Send documentation comments to mdsfeedback-doc@cisco.com.
32-10
Cisco MDS 9000 Family Fabric Manager Configuration Guide
OL-6965-03, Cisco MDS SAN-OS Release 2.x
Chapter 32 Network Monitoring
Health and Event Monitoring
You can view switch-resident logs even if you have not set up your local syslog server or your local PC
is not in the switch's syslog server list. Due to memory constraints, these logs will wrap when they reach
a certain size. The switch syslog has two logs: an NVRAM log that holds a limited number of critical
and greater messages and a nonpersistent log that contains notice or greater severity messages. Hardware
messages are part of these logs.
Health and Event Monitoring
Fabric Manager works with the Cisco MDS 9000 Family switches to show the health and status of the
fabric and switches. Information about the fabric and its components is gathered from multiple sources,
including Online System Health Management, Call Home, system messages, and SNMP notifications.
This information is then made available from multiple menus on Fabric Manager or Device Manager.
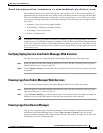
Fabric Manager Events Tab
The Fabric Manager Events tab, available from the topology window, displays the events Fabric Manager
received from sources within the fabric. These sources include SNMP events, RMON events, system
messages, and system health messages. The Events tab shows a table of events, including the event name,
the source and time of the event, a severity level, and a description of the event. The table is sortable by
any of these column headings.
Event Information in Fabric Manager Web Services Reports
The Fabric Manager web services client displays collections of information gathered by the Performance
Manager. This information includes events sent to the Fabric Manager Server from the fabric. To open
these reports, choose Performance Manager > Reports. This opens the web client in a web browser
and displays a summary of all fabrics monitored by the Fabric Manager Server. Choose a fabric and then
click the Events tab to see a summary or detailed report of the events that have occurred in the selected
fabric. The summary view shows how many switches, ISLs, hosts, or storage elements are down on the
fabric and how many warnings have been logged for that SAN entity. The detailed view shows a list of
all events that have been logged from the fabric and can be filtered by severity, time period, or type.
Events in Device Manager
Device Manager displays the events when you choose Logs > Events. Device Manager can display the
current list of events or an older list of events that has been stored on the Fabric Manager host. The event
table shows details on each event, including time, source, severity, and a brief description of the event.