


Send documentation comments to mdsfeedback-doc@cisco.com.
4-6
Cisco MDS 9000 Family Fabric Manager Configuration Guide
OL-6965-03, Cisco MDS SAN-OS Release 2.x
Chapter 4 Device Manager
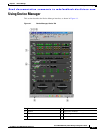
Using Device Manager
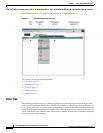
Selected Interface Traffic Util% button. To display detailed statistics for selected objects, click the
Monitor Selected Interface Traffic Details button. You can set the poll interval, the type or Rx/Tx
display, and the thresholds.
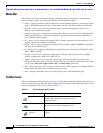
Legend
The legend at the bottom right of the Device Manager indicates port status, as follows:
Colors
• Green—The port is up.
• Brown—The port is administratively down.
• Red—The port is down or has failed.
• Amber—The port has a minor fault condition.
• Gray—The port is unreachable.
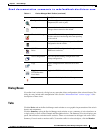
Labels
• X—Link Failure
• E—ISL
• TE—Multi-VSAN ISL
• F—Host/Storage
• FL—F Loop
• I— iSCSI