


Send documentation comments to mdsfeedback-doc@cisco.com.
6-2
Cisco MDS 9000 Family Fabric Manager Configuration Guide
OL-6965-03, Cisco MDS SAN-OS Release 2.x
Chapter 6 Performance Manager
Performance Manager Architecture
Data Interpolation
One of the unique features of Performance Manager is its ability to interpolate data when statistical
polling results are missing or delayed. Other performance tools may store the missing data point as zero,
but this can distort historical trending. Performance Manager interpolates the missing data point by
comparing the data point that preceded the missing data and the data point stored in the polling interval
after the missing data. This maintains the continuity of the performance information.
Data Collection
One year’s worth of data for two variables (Rx and Tx bytes) requires a round-robin database (rrd) file
size of 76K. If errors and discards are also collected, the rrd file size becomes 110K. The default internal
values are:
• 600 samples of 5 minutes (2 days and 2 hours)
• 700 samples of 30 minutes (2 days and 2 hours, plus 12.5 days)
• 775 samples of 2 hours (above plus 50 days)
• 300 samples of 1 day (above plus300 days, rounded up to 365)
A 1000-port SAN requires 110 MB for a year’s worth of historical data that includes errors and discards.
If there were 20 switches in this SAN with equal distribution of fabric ports, about two to three SNMP
packets per switch would be sent every 5 minutes for a total of about 100 request or response SNMP
packets required to monitor the data.
Flows, because of their variable counter requests, are more difficult to predict storage space
requirements for. But as a rule of thumb, each extra flow adds another 76 kB.
The Performance Manager collector runs as a background process on the various supported operating
systems. On Microsoft Windows, it runs as a service.
Using Performance Thresholds
The Performance Manager Configuration Wizard allows you to set up two thresholds that will trigger
events when the monitored traffic exceeds the percent utilization configured. These event triggers can be
set as either Critical or Warning events that are reported on the Fabric Manager web client Events
browser page.
Absolute value thresholds apply directly to the statistics gathered. These statistics, as a percent of the
total link capacity, are compared to the percent utilization configured for the threshold type. If the
statistics exceed either configured threshold, an event is shown on the Fabric Manager web client Events
tab.
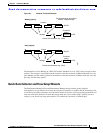
Baseline thresholds create a threshold that adapts to the typical traffic pattern for each link for the same
time window each day, week, or every two weeks. Baseline thresholds are set as a percent of the average
(110% to 500%), where 100% equals the calculated weighted average. Figure 6-1 shows an example of
setting a baseline threshold for a weekly or daily option.