


Send documentation comments to mdsfeedback-doc@cisco.com.
33-4
Cisco MDS 9000 Family Fabric Manager Configuration Guide
OL-6965-03, Cisco MDS SAN-OS Release 2.x
Chapter 33 Performance Monitoring
Historical Performance Monitoring
Using Performance Thresholds
The Performance Manager Configuration Wizard allows you to set up two thresholds that will trigger
events when the monitored traffic exceeds the percent utilization configured. These event triggers can be
set as either Critical or Warning events that are reported on the Fabric Manager web client Events
browser page.
You must choose either absolute value thresholds or baseline thresholds that apply to all transmit or
receive traffic defined in the collection. Click the Use absolute values radio button on the last screen of
the Performance Manager Configuration Wizard to configure thresholds that apply directly to the
statistics gathered. These statistics, as a percent of the total link capacity, are compared to the percent
utilization configured for the threshold type. If the statistics exceed either configured threshold, an event
is shown on the Fabric Manager web client Events tab.
As an example, the collection has absolute value thresholds set for 60% utilization (for warning) and
80% utilization (for critical). If Performance Manager detects that the traffic on a 1-Gigabit link in its
collection exceeds 600 Mbps, a warning event is triggered. If the traffic exceeds 800 Mbps, a critical
event is triggered.
Baseline thresholds are defined for a configured time of day or week (1 day, 1 week, or 2 weeks). The
baseline is created by calculating the average of the statistical results for the configured time each day,
week, or every 2 weeks. Table 33-3 shows an example of the statistics used to create the baseline value
for a collection defined at 4 pm on a Wednesday.
Baseline thresholds create a threshold that adapts to the typical traffic pattern for each link for the same
time window each day, week, or every 2 weeks. Baseline thresholds are set as a percent of the average
(110% to 500%), where 100% equals the calculated average.
As an example, a collection is created at 4 pm on Wednesday, with baseline thresholds set for 1 week,
at 150% of the average (warning) and 200% of the average (critical). Performance Manager recalculates
the average for each link at 4 pm every Wednesday by taking the statistics gathered at that time each
Wednesday since the collection started. Using this as the new average, Performance Manager compares
each received traffic statistic against this value and sends a warning or critical event if the traffic on a
link exceeds this average by 150% or 200% respectively.
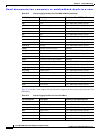
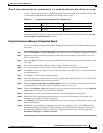
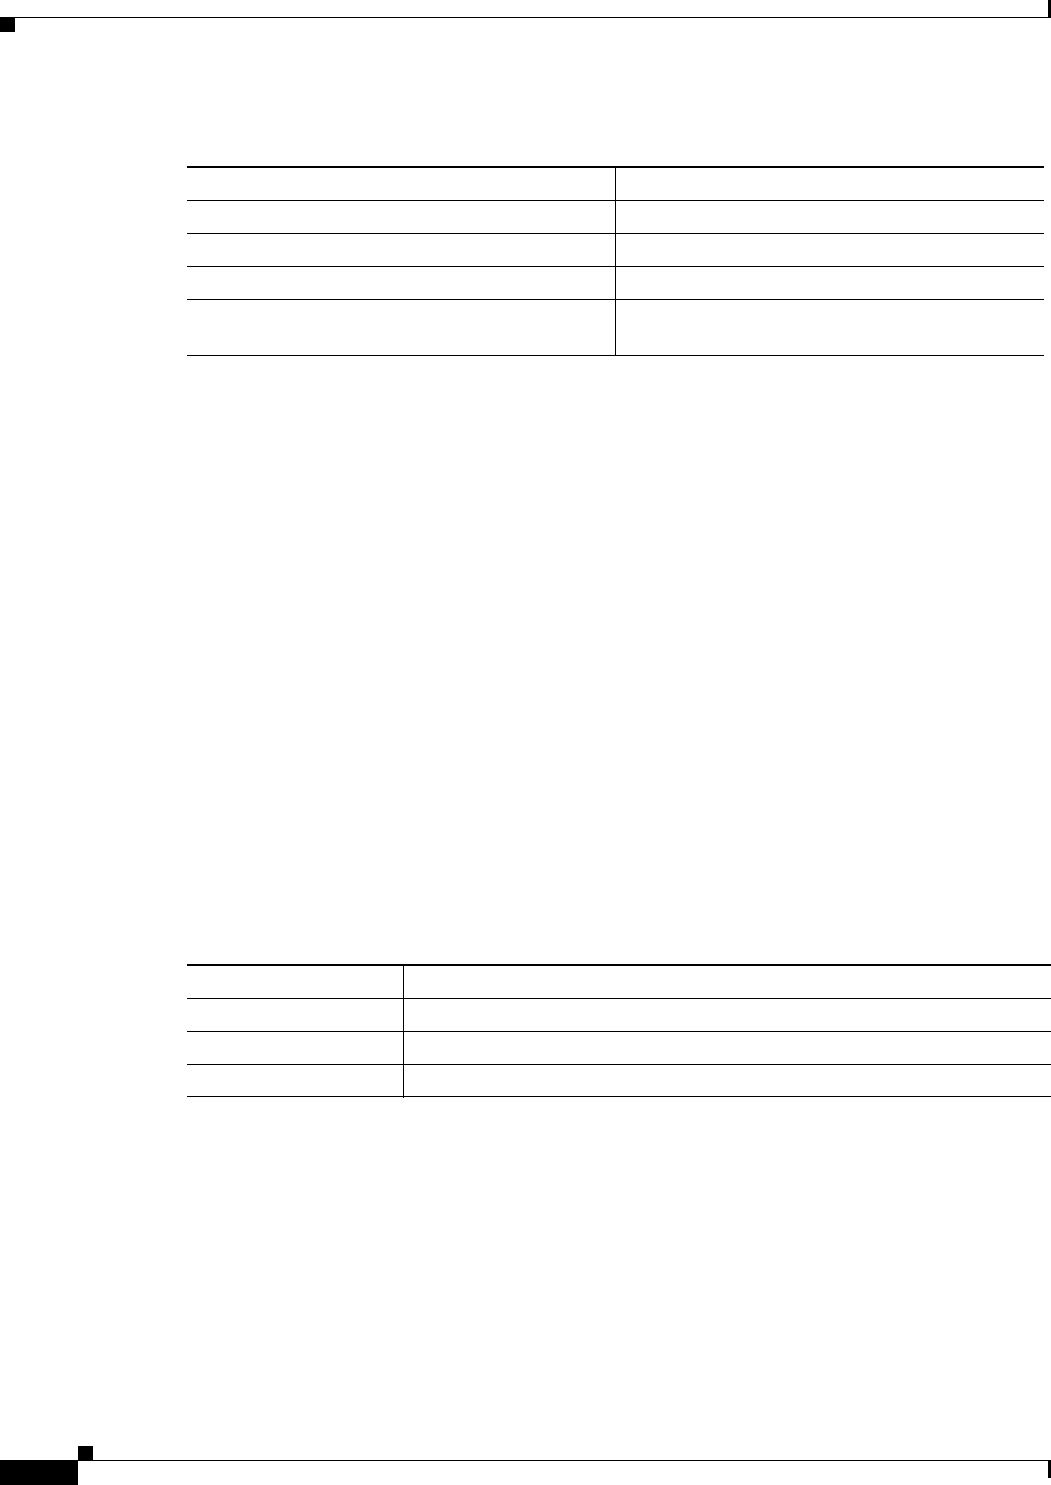
Table 33-2 Performance Manager Collection Types
Collection Type Description
ISLs Collects link statistics for ISLs.
Host Collects link statistics for SAN hosts.
Storage Collects link statistics for a storage elements.
Flows Collects flow statistics defined by the Flow
Configuration Wizard.
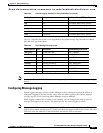
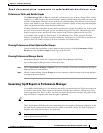
Table 33-3 Baseline Time Periods for a Collection Started on Wednesday at 4pm
Baseline Time Window Statistics Used in Average Calculation
1 day Every prior day at 4 pm
1 week Every prior Wednesday at 4 pm
2 weeks Every other prior Wednesday at 4 pm