


EXCEL 10 W7750A,B,C CONSTANT VOLUME AHU CONTROLLER
115 74-2958—1
Sensor Use:
CO
2
concentration
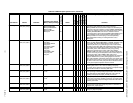
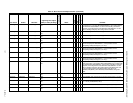
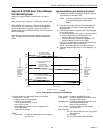
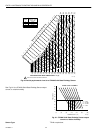
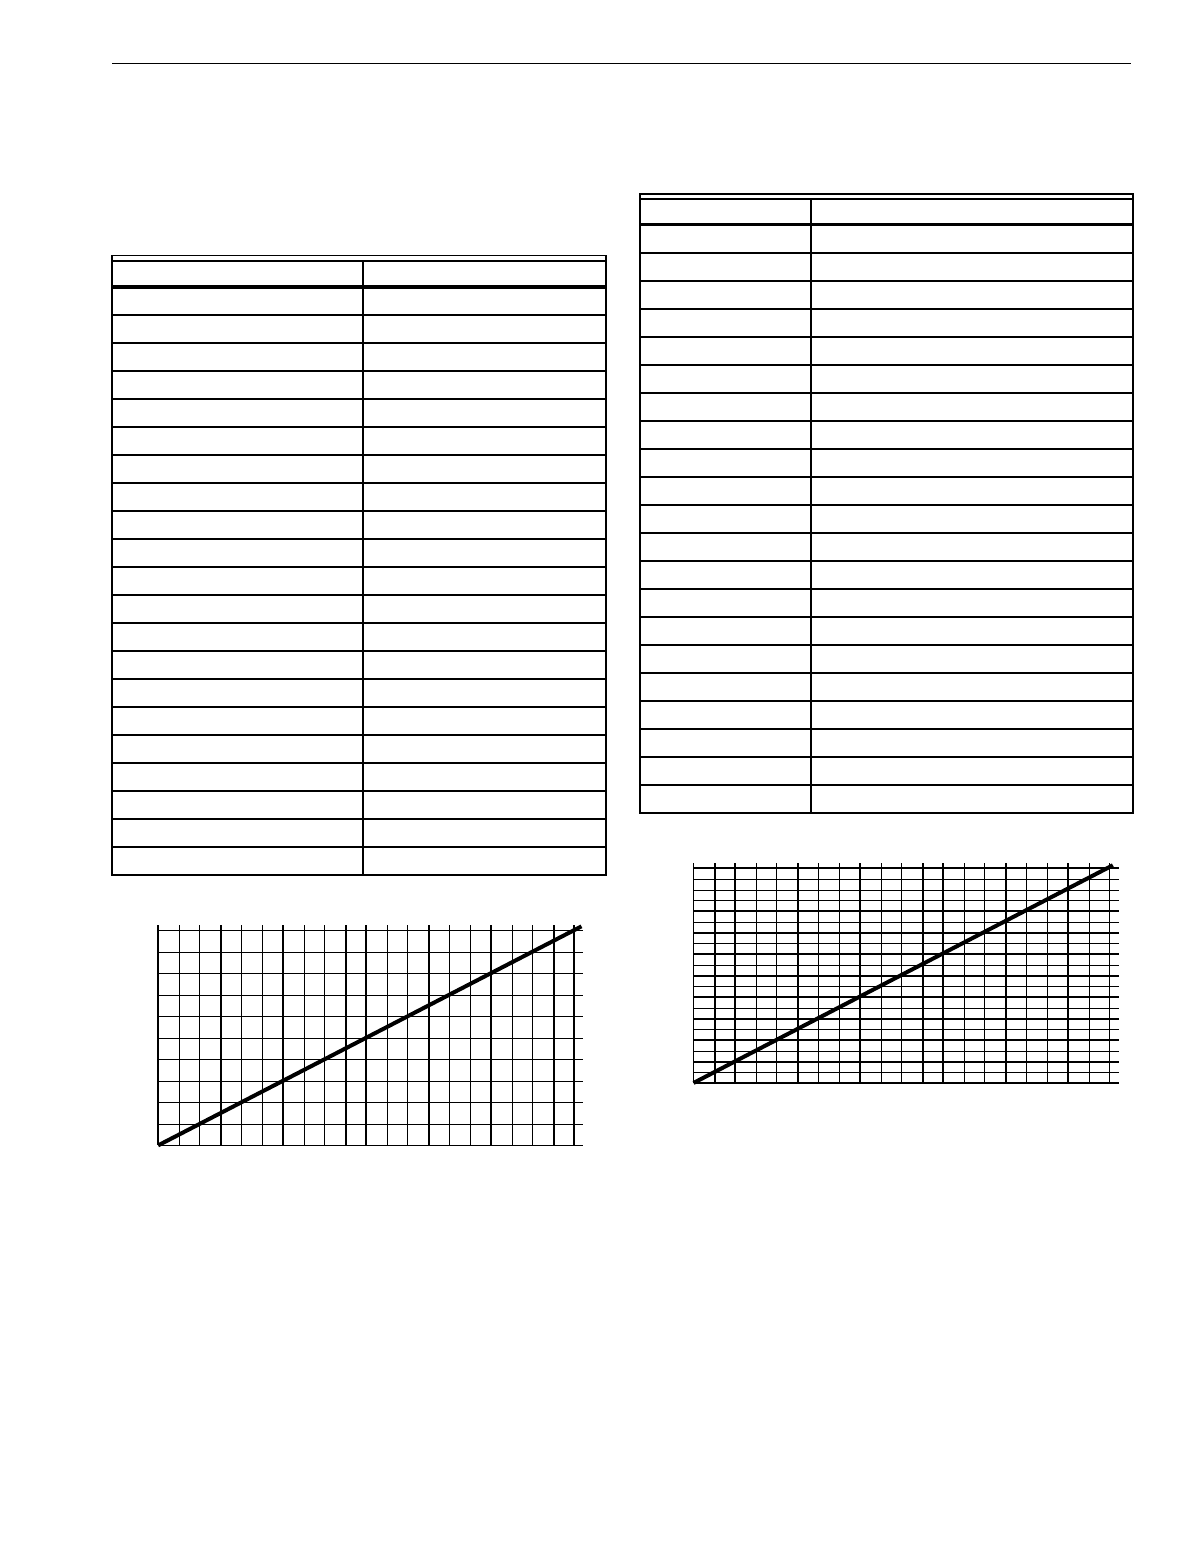
Table 37 lists the points for Sensor Volta
g
e versus CO
2
concentration. Fi
g
. 62 shows the
g
raph of these points.
Table 37. Sensor Voltage Versus CO
2
Concentration.
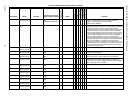
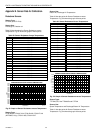
Fig. 62. Graph of Sensor Voltage versus CO
2
concentration.
Sensor Type:
Third part
y
(
2 to 10V
)
Sensor Use:
Monitor volta
g
e
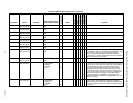
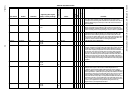
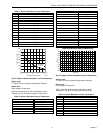
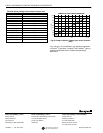
Table 38 lists the points for Sensor Volta
g
e versus input
Volta
g
e to A/D. Fi
g
. 63 shows the
g
raph of these points.
Table 38. Sensor Voltage Versus Input Voltage To A/D.
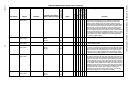
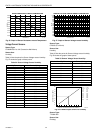
Fig. 63. Graph of Sensor Voltage versus input Voltage to
A/D.
Sensor Type:
Third part
y
Sensor Use:
Sensor Volta
g
e
(
Vdc
)
/Pressure
(
Inw
)
2 to 10V, 0 to 5 inw
(
1.25 kPa
)
Table 39 lists the points for Sensor Volta
g
e
(
Vdc
)
versus
Pressure
(
Inw
)
. Fi
g
. 64 shows the
g
raph of these points.
CO
2
Concentration PPM
Sensor Voltage
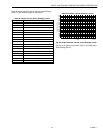
00.00
100 0.50
200 1.00
300 1.50
400 2.00
500 2.50
600 3.00
700 3.50
800 4.00
900 4.50
1000 5.00
1100 5.50
1200 6.00
1300 6.50
1400 7.00
1500 7.50
1600 8.00
1700 8.50
1800 9.00
1900 9.50
2000 10.00
0
1
2
3
4
5
6
7
8
9
10
100 300 500 700 900 1100 1300 1500 1700 1900
200 400 600 800 1000 1200 1400 1600 1800 2000
VOLTS
PPM
SENSOR VOLTAGE VERSUS CO2 CONCENTRATION
M11611
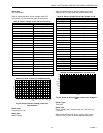
Voltage to A/D Sensor Voltage
0.00 0.00
0.50 0.25
1.00 0.50
1.50 0.75
2.00 1.00
2.50 1.25
3.00 1.50
3.50 1.75
4.00 2.00
4.50 2.25
5.00 2.50
5.50 2.75
6.00 3.00
6.50 3.25
7.00 3.50
7.50 3.75
8.00 4.00
8.50 4.25
9.00 4.50
9.50 4.75
10.00 5.00
0
0.50
1.00
1.50
2.00
2.50
3.00
3.50
4.00
4.50
5.00
1000 300 500 700 900200 400
600 800
1000
A/D VOLTS
VOLTS
SENSOR VOLTAGE VERSUS INPUT VOLTAGE TO A/D
M11612