


3-7
Eye-Diagram Analyzer Reference
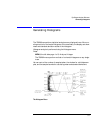
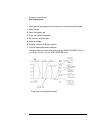
Generating Histograms
Generating Histograms
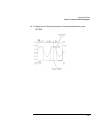
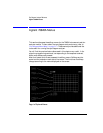
The 70820A can perform statistical analysis on any displayed trace. After cre-
ating a vertical or horizontal histogram of the trace data, the display can show
mean and standard deviation values of the histogram.
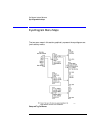
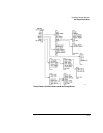
Histogram analysis is performed using the Histogram menu.
Press:
MENU, the left-side page 1 of 2, Analyze, Histogm
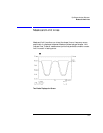
The 70820A menus perform vertical or horizontal histograms on any single
trace
You can control the number of samples taken, the window for valid data sam-
ples, and the sample bounds for calculating mean and standard deviations
The Histogram Menu