


Application Tutorials
Tutorial 10: Create a Vertical Histogram
Tutorial 10: Create a Vertical Histogram
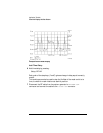
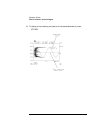
This tutorial creates a vertical histogram on data taken from a sine wave. The
procedure, however, works for any type of waveform.
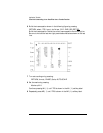
Select the Histogram Type
1 Display a trace to perform statistical analysis on.
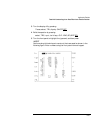
2 Display the histogram menu by pressing:
page 1 of 2, Analyze, histogm
3 Select the trace to perform the statistical analysis on by pressing:
trace:
Use the knob to select the desired trace.
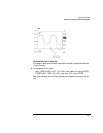
4 Select the Vertical Histogram function by pressing:
histog:, VERTICL HISTOGM VERTICL HISTOGM
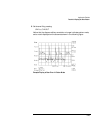
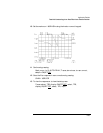
Acquire the Data
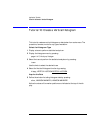
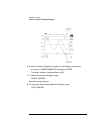
5 Define the window for taking histogram data by pressing:
other, WINDOW MARKER1, WINDOW MARKER2
Notice the values of the marker positions are indicated at the top of the dis-
play.