


Eye-Diagram Analyzer Reference
Agilent 70820A User-Corrections
Example User-Corrections
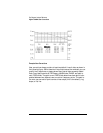
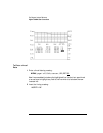
User corrections always contain at least two default lines of data, as shown in
the following figure. While these two lines of data cannot be removed, you can
modify their magnitude or phase values. New lines of data are easily added.
Each line of data consists of FREQuency, MAGNitude, PHASE, and path to
next FREQ fields. The path to next FREQ field determines how data is inter-
polated between two adjacent user-correction frequency points. The path to
the next user-correction point can be a linear slope (this is the default), log
slope, or flat line.