


Getting Started
Getting Started with the Eye-Diagram Analyzer
Getting Started with the Eye-Diagram
Analyzer
In this chapter, you will find information on the following topics:
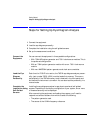
• Steps for Setting Up Eye-Diagram Analysis 1-4
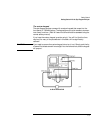
• Step 1. Connect the Equipment 1-12
• Step 2. Load the Personality 1-16
• Step 3. Complete the Installation Using the Screen Instructions 1-19
• Step 4. Set Up the Measurement Conditions 1-22
• Optional Step. Save Instrument State as Preset State 1-26
The Agilent 71501D Eye-Diagram Analysis
You can configure the 71501D system as a high-speed eye-diagram analyzer
using Option 005 eye-diagram analysis software. This software allows the sys-
tem to operate similar to a high-speed sampling oscilloscope such as the Agi-
lent 86100A Infiniium DCA.
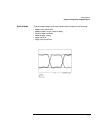
The 71501D can perform eye-diagram analysis such as extinction-ratio testing
and mask testing. In addition, the software allows the system to operate in
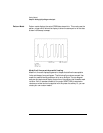
Agilent Eyeline mode. In eyeline mode the eye-diagram display shows contin-
uous traces instead of synchronous dots. This allows pattern dependent
effects to be investigated. For example, the trace leading to a mask violation
can be captured and displayed. The eyeline eye-diagram can take advantage of
trace averaging. Therefore, very small energy signals can be extracted from
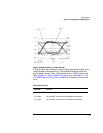
broadband noise. Finally, eye-diagrams can be analyzed using software filters.
Fourth-order Bessel-Thompson filters can be easily designed for virtually any
data rate allowing analysis without having to actually construct a hardware fil-
ter.