


34 Troubleshooting
Troubleshooting Charts
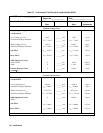
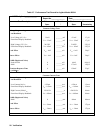
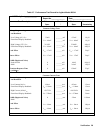
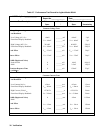
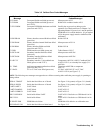
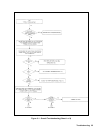
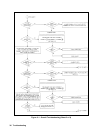
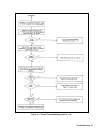
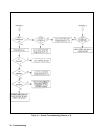
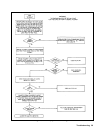
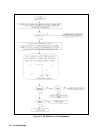
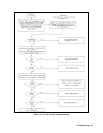
Figure 3-1 gives overall troubleshooting procedures to isolate the fault to a circuit board or particular circuit (see Figure
3-20 for the location of the circuit boards). These procedures include the use of power-on selftest (Table 3-2) and signature
analysis techniques (Table 3-5 through Table 3-7). Some results of Figure 3-1 lead to more detailed troubleshooting charts
that guide you to specific components. The troubleshooting charts are organized as follows:
Chart Trouble or Circuit
Figure 3-1 Overall procedure checks selftest errors, calibration errors, ac input circuit, fan, readback
circuits, A10 Control Board, GPIB cable, digital port, serial link, rotary controls, current
amplifier.
Figure 3-2 No display (from Figure 3-1).
Figure 3-3 OV circuit not firing (from Figure 3-1).
Figure 3-4 OV circuit is on at turn on (from Figure 3-1).
Figure 3-5 Output level is held low (from Figure 3-1).
Figure 3-6 Output level is held high (from Figure 3-1).
Figure 3-7 DAC circuits (from Figure 3-1).
Figure 3-8 DAC test waveforms.
Figure 3-9 CV and CC DAC and amplifiers (from Figure 3-1).
Figure 3-10 Serial Down circuit (from Figure 3-1).
Figure 3-11 Secondary interface circuit (from Figure 3-1).
Figure 3-12 Slow downprogramming circuit (from Figure 3-1).
Troubleshooting Test Points
The troubleshooting charts reference test points listed in Table 6-3 of Chapter 6. Test points are identified by an encircled
number (such as U in schematic diagrams and component location drawings, also in Chapter 6).
Bias and Reference Supplies
Many of the following troubleshooting procedures begin by checking the bias and/or reference voltages. Table 6-3 lists the
test points for these voltages and gives the correct reading for each. The circuit board component location diagrams identify
these points on each board.