


Welcome to CarChip
61
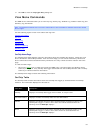
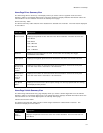
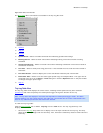
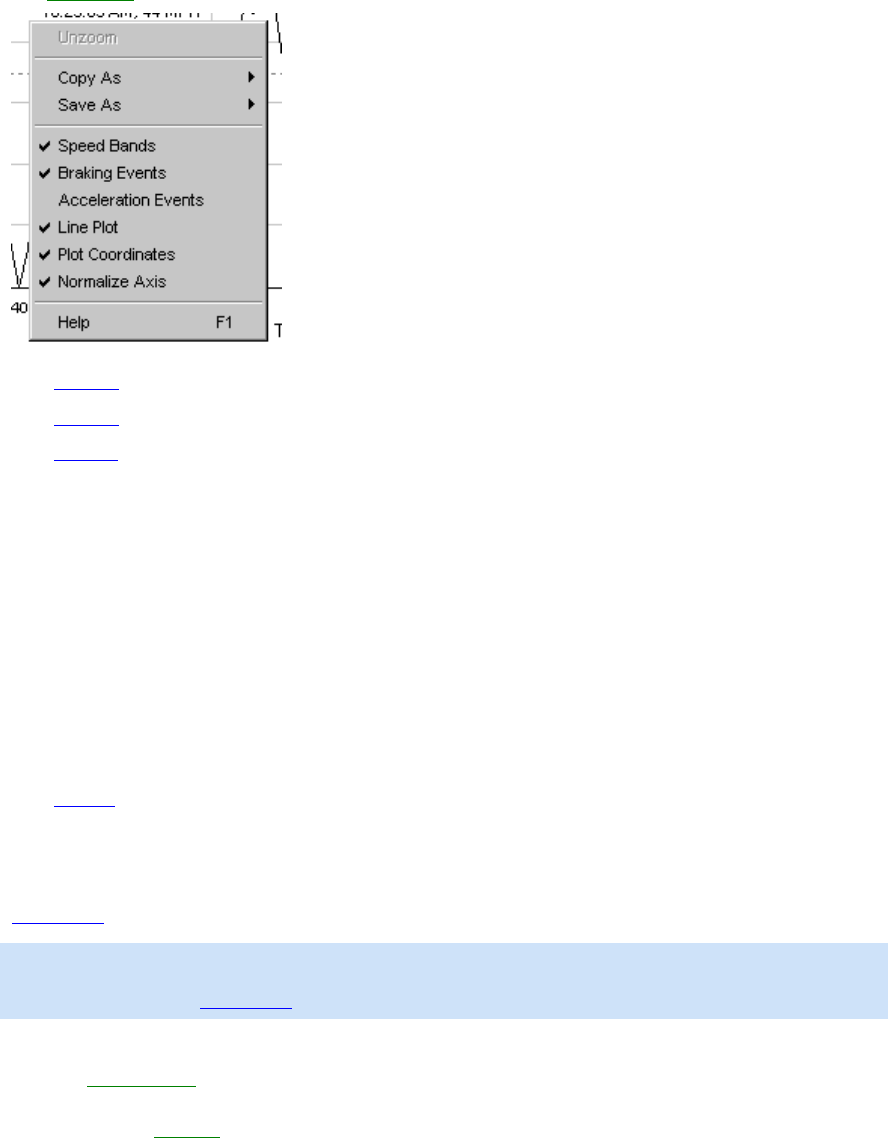
Right-Click Menu Commands:
The Right-Click
Menu commands are available in the Trip Log Plot view:
• Unzoom
• Copy As
• Save As
• Speed Bands - Select to include horizontal lines indicating speed band settings.
• Braking Events - Select to draw vertical lines indicating braking events that exceed a braking
threshold.
• Acceleration Events - Select to include vertical lines indicating acceleration events that exceed an
acceleration threshold.
• Line Plot - Select to draw plots using plain lines. If not selected the area under the lines is filled in
with black.
• Plot Coordinates - Select to display the cursor coordinates inside the plot view window.
• Normalize Axes - Select to use the same upper speed range for all Speed Plots. The upper end of
the speed range is set in the Setup / Plots dialog box. Click the Options button in the plot window
to change the upper speed range.
• Help F1
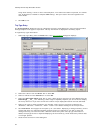
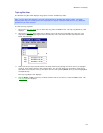
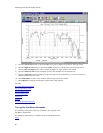
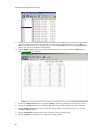
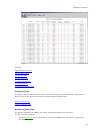
Trip Log Table View
The Trip Log Table view displays the all the values, including vehicle speed and any other selected
parameters
, that were sampled by the CarChip data logger through the duration of the trip.
Note: The trip data that displays in the table view depends on CarChip data logger model. The basic
CarChip displays only the vehicle speed in the table view. The CarChip E/X or higher model displays the
data for any additional parameters that have been selected.
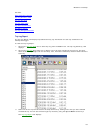
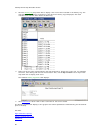
To view the Trip Log Table:
Click the Trip Log View
icon or Select Trip Log from the View menu. The Trip Log Summary view
displays.
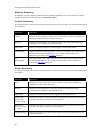
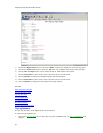
1. Click on the Trip Log
drop-down box to display a list of all trips recorded in the Trip Log. The drop-
down list box always begins with the Summary view, with each recorded trip listed in order below the
Summary.