


Welcome to CarChip
29
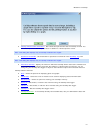
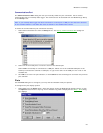
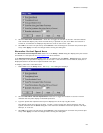
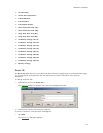
2. Click the Draw Plot Coordinates... check box to toggle the function on and off. A check indicates
that coordinates display only when the Control key is pressed in a plot view. When the function is
turned off, coordinates are displayed anytime the cursor is active over a plot.
3. Click OK to save the new plot setup. Click Cancel to exit the dialog box and retain the previous plot
setup. Click Apply to make the change without exiting the dialog box.
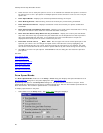
Normalize Vertical Speed Axes
The Normalize Vertical Speed Axes check box in the Setup / Plots dialog box displays the plot vertical
axis based on a set speed in the Trip Log Plot view
when selected.
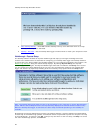
If the Normalize Vertical Speed Axes check box is selected from the Setup / Plots dialog box, the top
limit of the plot is the speed limit displayed in the text box. If this check box is not selected, each plot is
displayed based on the maximum speed reached in the plot.
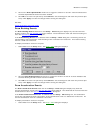
To display plots with a normalized axis:
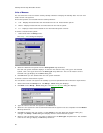
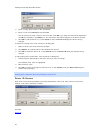
1. Select Plots from the Setup menu. The Setup / Plots
dialog box displays.
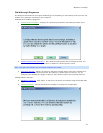
2. Click the Normalize Vertical Speed Axes check box to toggle the function on and off. A check
indicates that the plots display normalized speed axis.
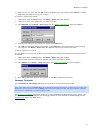
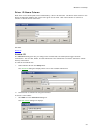
3. Type the speed that represents the top limit displayed in all the Trip Log Plot views.
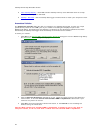
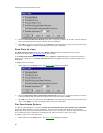
The default vertical axis value is 90 mph, 153 kph, or 42.5 meters per second, based on the unit
system selected from the Units dialog box. The maximum allowable vertical axis speed is 158 mph,
255 kph, or 70.8 m/s.
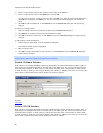
4. Click OK to save the new plot setup. Click Cancel to exit the dialog box and retain the previous plot
setup. Click Apply to make the change without exiting the dialog box.