


CarChip Online Help Printable Version
26
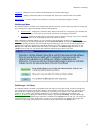
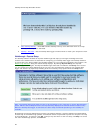
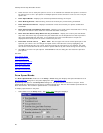
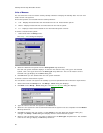
2. Check the box next to each plot option to turn it on. A checked box indicates the option is turned on.
De-select a box to turn a plot option off. Multiple options can be turned on or off at a time. The plot
options are:
• Draw Speed Bands - Displays your selected speed band settings in the plot.
• Draw Braking Events - Marks braking events that exceed your preset braking thresholds.
• Draw Acceleration Events - Displays acceleration events that exceed your preset acceleration
thresholds.
• Draw Plots using Lines Rather than Areas - Displays a line graph of the measured data. Turning
this option off turns the area under the measured data black in the plot.
• Draw Plot Coordinates Only When Ctrl Key is Pressed - Display the cursor's plot coordinates
only when the Control key is pressed. The plot coordinates are the elapsed time of the trip and the
data value associated with that time. If not checked, the cursor's coordinates on the plot are
displayed continuously when the cursor is within the plot area.
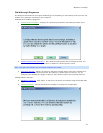
• Normalize vertical axes to ___ MPH / KPH - Set the upper limit of the vehicle speed plot to the
speed of your choice. You can change the speed used to normalize the axes by highlighting the
current speed setting with your cursor and then entering the new speed. If not checked, the upper
limit of the vertical axes will be the maximum speed achieved by the vehicle during the current trip.
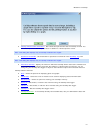
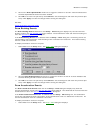
3. Click OK to save the new plot options. Click Cancel to exit the dialog box and retain the previous
plot options.
See Also:
Draw Speed Bands
Draw Braking Events
Draw Acceleration Events
Draw Plots Using Lines
Draw Plot Coordinates
Normalize Vertical Axis
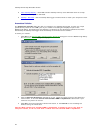
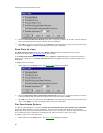
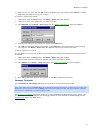
Draw Speed Bands
The Draw Speed Bands check box in the Setup / Plots dialog box displays the speed limitations set in
Set Speed Bands
dialog box in the plots displayed in the Trip Log Plot view.
By selecting this option in the Setup/Plots dialog box, the speed bands are drawn in the plot. These
speed bands are represented in the plot by horizontal dotted lines. The two intermediate speed bands are
black dotted lines. The maximum speed band is a red dotted line.
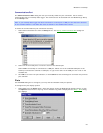
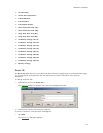
To display speed bands in the plots:
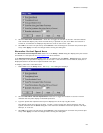
1. Select Plots from the Setup menu. The Setup / Plots
dialog box displays.