


CarChip Online Help Printable Version
28
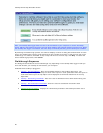
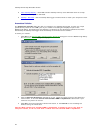
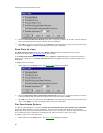
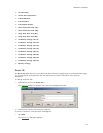
2. Click the Draw Acceleration Events check box to toggle the function on and off. A check indicates
that the Draw Acceleration Events function has been enabled.
3. Click OK to save the new plot setup. Click Cancel to exit the dialog box and retain the previous plot
setup. Click Apply to make the change without exiting the dialog box.
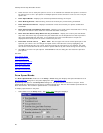
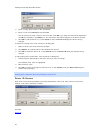
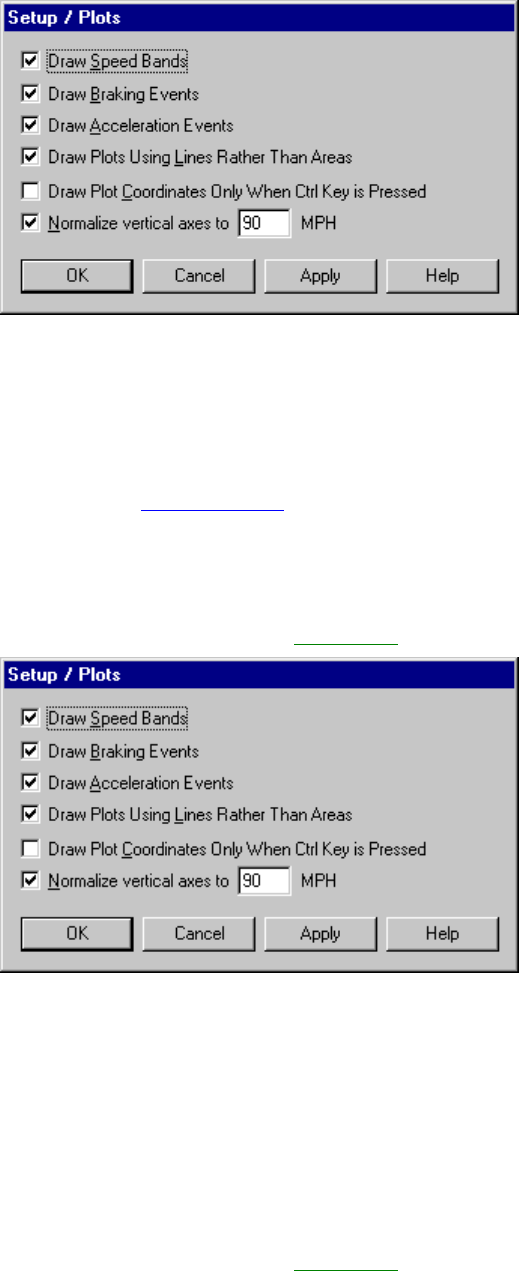
Draw Plots As Lines
The Draw Plots As Lines check box in the Setup / Plots dialog box displays the trip and plot
information in lines in the Trip Log Plot view
when selected.
If the Draw Plots As Lines box is selected from the Setup / Plots dialog box, the plot information is
displayed as a black line. If the Draw Plots As Lines box is toggled off, the area under the plot line is
filled black.
To display lines in the plots:
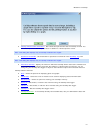
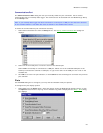
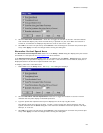
1. Select Plots from the Setup menu. The Setup / Plots
dialog box displays.
2. Click the Draw Plots Using Lines Rather Than Areas check box to toggle the function on and off.
A check indicates that the Draw Plots Using Lines function has been enabled.
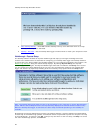
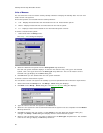
3. Click OK to save the new plot setup. Click Cancel to exit the dialog box and retain the previous plot
setup. Click Apply to make the change without exiting the dialog box.
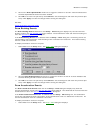
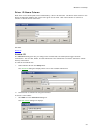
Plot Coordinates Options
The Setup \ Plots dialog box contains the Draw Plot Coordinates Only when Central key Is Pressed
check box. When selected, the plot coordinates, which include the time and speed of the coordinate
display when the Control key is pressed with the cursor over a coordinate in the plot. When the check box
is not selected, the plot coordinates are displayed any time the cursor is active over a plot.
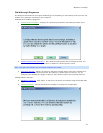
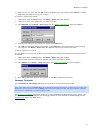
To display plots with a normalized axis:
1. Select Plots from the Setup menu. The Setup / Plots
dialog box displays.