


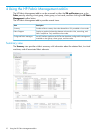
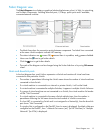
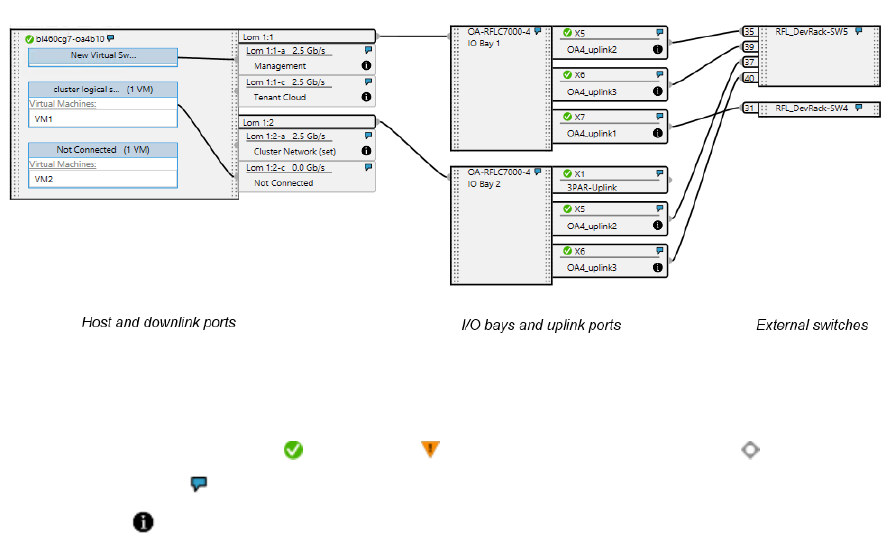
Fabric Diagram view
The Fabric Diagram view displays a graphical relationship between a host, its VMs, its networking,
and its fabric components, including downlink ports, I/O bays, uplink ports and if available,
connected external switches.
• The black lines show the connection points between components. Two black lines connected
at the same vSwitch endpoint indicate NIC teaming.
• The status indicators are: means OK, means there is a problem, and means disabled.
• Hover over the icon to get further details.
• Click the icon to get further details.
• The scale of the diagram can be changed using the Scale slider bar or by using Ctrl+mouse
wheel.
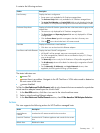
Hosts and downlink ports
In the host diagram box, each list box represents a vSwitch and contains all virtual machines
connected to that particular vSwitch.
• The number in parentheses following the vSwitch name shows the number of virtual machines
connected to that vSwitch.
• If a virtual machine is connected to an internal or private vSwitch, it will not be listed.
• If a virtual machine is connected to multiple vSwitches, it appears in multiple vSwitch list boxes.
• If a group of virtual machines are not connected to a vSwitch, the virtual machine list header
will be “Not Connected.”
• If a virtual machine is connected to the same vSwitch multiple times, then the number in
parentheses following the VM name shows the total number of vSwitch connections.
• If a host NIC is connected to vSwitch and is not assigned to a Network(s), then the downlink
port shows “Not Connected.”
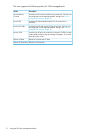
• If a single vNet is configured on the FlexNIC, then its name is displayed. If multiple vNets are
configured on the FlexNIC, then “<Network Set name> (set)” (for HP OneView) or “Multiple
Networks” (for VCM) is displayed.
Fabric Diagram view 13