


How to Use the NMS200
30
ProSafe NMS200 Network Management System
• Network availability
• Bandwidth capacity utilization
• Buffer usage and errors
• CPU and memory utilization
• Interface errors and discards
• Network latency
• Node and interface status
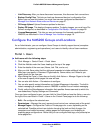
To get started using monitors, follow these steps:
1. Click Performance Management > Summary, and find the Resource Monitors portlet
on that page.
2. Hover the cursor over a Monitor of interest to see a tooltip of details about it.
3. Click to select a Monitor of interest.
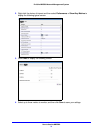
4. Right-click the selected monitor in the Resource Monitors portlet, and then click Open to edit
its details, including enabling/disabling it.
Dashboard Views
With permissions, you can view the performance data collected by the monitors, in graphical
and tabular form including:
• Excessive interface utilization
• Unexpectedly high CPU load
• Loss of available memory
• Slow response time
• Excessive interface errors
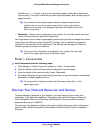
To view this data, follow these steps:
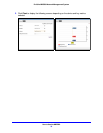
1. Click Performance Management > Summary and find the Top Problem Nodes portlet.
2. Hover the cursor over a Device/Interface of interest to see a tooltip of details about its status.
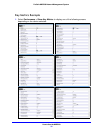
3. Right-click and select Show Key Metrics, or Show Performance, which opens a
dashboard.
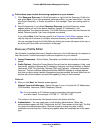
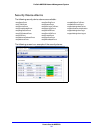
Use the NMS200 with Security Devices
The NMS200 provides basic security information in the Show Key Metrics window.
To view the key security metrics:
1. Click Resources > Summary to display the list of managed resources.