


Cisco Internal Use Only
Copyright © 2006 Cisco Systems, Inc. All rights reserved.
Page 47 of 66
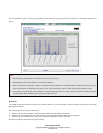
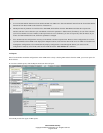
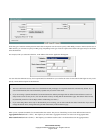
Select the type of statistics and the particular metric that are required. You also need to specify which DSG you want to monitor (In the case of
ART statistics, you will need to specify an ART group). Depending on the type of statistic required more fields will appear and you can further
tailor the threshold.
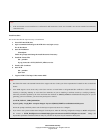
For example, when you select Host Statistics, an IP Address field and an Application field appear.
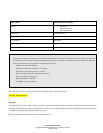
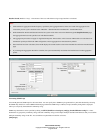
You can select the minimum severity level required and Cisco PVM allows you to define the values for that and all other higher severity levels.
Specify a name and description for the threshold.
Note:
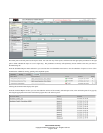
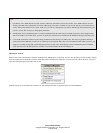
1. The area to define the absolute values for a fixed threshold and percentages for a dynamic threshold is minimized by default. If you
select fixed Threshold, this area automatically expands and you can fill in the values.
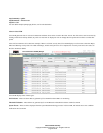
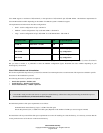
2. If you are creating a dynamic threshold, Cisco PVM assumes the default percentages that are defined in the Preferences section of
Setup for the various severity levels. (You can edit these values by clicking Edit in the Preferences page. The default values are 100,
80, 60 and 40 percent for Critical, Major, Minor and Warning level alerts.)
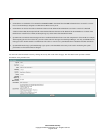
3. If you want change these values only for the threshold you are creating, you can select and edit the values from the list. If you want to
change the default values, change them using the Edit functionality in the Preferences page.
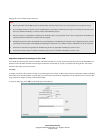
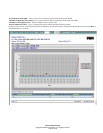
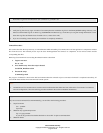
When you set a dynamic threshold, Cisco PVM baselines the statistic. The process of baselining involves three different time intervals.
Aggregation Period (Default is 5 mins) – The frequency at which data is aggregated and alerts are issued over the aggregated data.
Observation Period (Default is 60 mins) – The frequency at which the baseline value is recalculated based on the aggregated data.