


Cisco Internal Use Only
Copyright © 2006 Cisco Systems, Inc. All rights reserved.
Page 35 of 66
Overview of PVM functionality
You now have an understanding of usage of Cisco PVM with some of the scenarios mentioned earlier This section will explain all the features
of Cisco PVM to provide a thorough overview of Cisco PVM capabilities.
Traffic Analysis using Cisco PVM
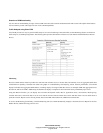
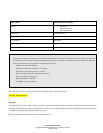
Cisco PVM provides two ways to perform traffic analysis. For active monitoring of network traffic, use the Monitoring feature. For historical
traffic analysis, use the Reporting feature. The following table provides information on when to use each feature and the differences between
the two.
Monitoring
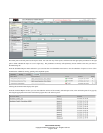
The Cisco PVM monitor function provides near real-time and real-time access to resource data, and summary views of aggregated traffic data
with drill-down capability, formatted into tables and graphs for troubleshooting and analyzing current network performance. Cisco PVM
displays individual and aggregated NAM metrics, including displays for single NAM data sources, for multiple NAM data aggregated across
the network, and for all NAMs. Additionally, the Monitor tab displays a snapshot of current network activity immediately upon access.
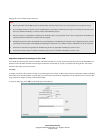
Using the Monitor function, you can display near real-time and dynamic traffic data for applications, hosts, conversations, DCSP groups,
switches and routers, and VLAN data. You can view network resources based on these data sources and drill down to access details about a
particular resource. Reports can be viewed, printed, and saved as PDF, Microsoft Excel, and Rich Text Format files.
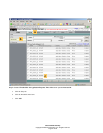
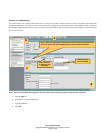
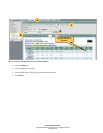
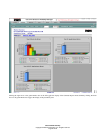
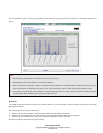
To access the Monitoring functionality, click the Monitoring tab. Cisco PVM automatically displays a Network Overview Report for the first
DSG in the list, and the following screen is seen.