


Cisco Internal Use Only
Copyright © 2006 Cisco Systems, Inc. All rights reserved.
Page 38 of 66
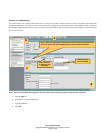
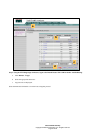
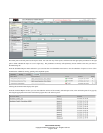
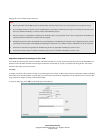
Datasource – This scheme allows the user to view traffic statistics per datasource.
Aggregated – This scheme allows the user to view aggregated traffic statistics for all datasources in the DSG.
All NAM – This scheme allows the user to view traffic statistics aggregated per NAM in the DSG.
These aggregation schemes are available for all report suites. For the Switch/Router report suite, the All NAM scheme is called All Device.
Note:
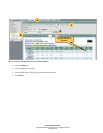
1. If the user selects All NAM, the report that is shown could have multiple pages, one per NAM.
2. Also, if the selected DSG has multiple NAMs and Cisco PVM has not been able to gather traffic statistics from some NAMs for any
reason, it will display a “No Data Found” message for those NAMs but will display the traffics statistics for those NAMs that it has
collected traffic statistics from. Use the report navigation links located at the top of the report to navigate the report.
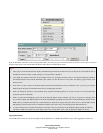
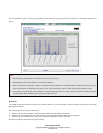
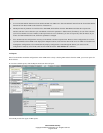
Report Views
Cisco PVM provide three types of report views. These are:
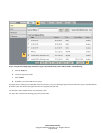
Cumulative – This is a tabular representation of the absolute cumulative data over the chosen time period.
Current Rates – This is a tabular representation of the rate over the chosen time period. (Cumulative data divided by the number of seconds in
the time period)
Top N – This represents the Top N over the chosen time period for a given statistic.
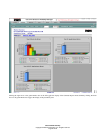
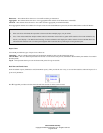
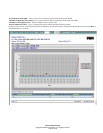
Real-Time and Trend Charts
From the tabular reports (Cumulative and Current Rate reports), links provide the user a way to see real-time statistics and trend reports for a
given set of parameters.
The “R” hyperlink provides a window where the real-time statistic of choice can be viewed.