


True RMS Multimeters
Using the Bar Graph
9
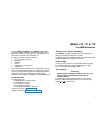
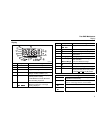
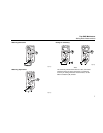
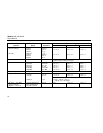
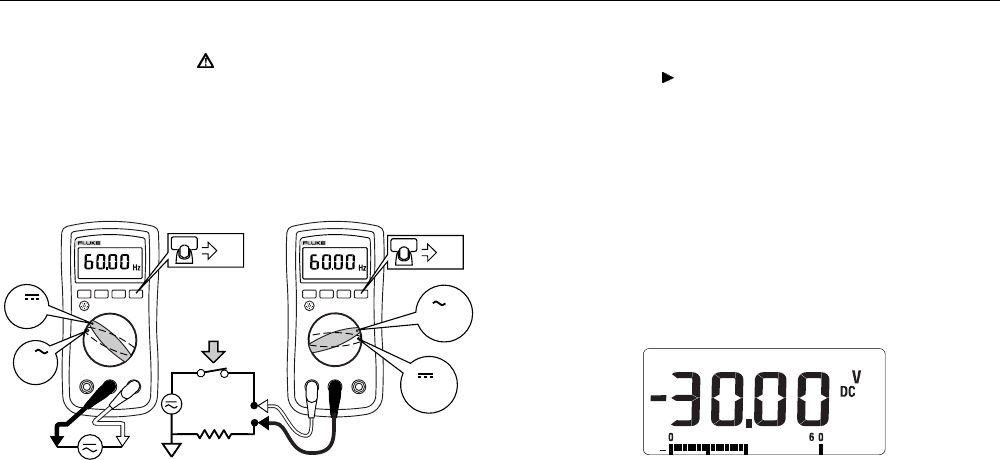
Measuring Frequency
Warning
To avoid electrical shock, disregard the bar graph for
frequencies > 500 Hz. If the frequency of the measured
signal is > 500 Hz, the bar graph is unspecified.
The Meter measures the frequency of a signal by counting the
number of times the signal crosses a trigger level each second.
The trigger level is 0 V, 0 A for all ranges.
Hz
AC/DC Voltage Frequency AC/DC Current Frequency
Hz
V
Hz
V
Hz
A
Hz
A
Hz
aej09f.eps
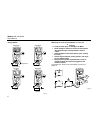
⇒ Press Hz to turn the frequency measurement function on and
off.
⇒ In frequency, the bar graph and range annunciator indicate
the AC or DC voltage or current present.
⇒ Select progressively lower ranges using manual ranging for a
stable reading.
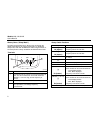
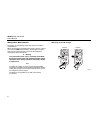
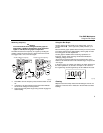
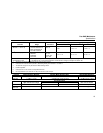
Using the Bar Graph
The bar graph is like the needle on an analog meter. It has an
overload indicator ( ) to the right and a polarity indicator (±) to
the left.
Because the bar graph updates about 40 times per second, which
is ten times faster than the digital display, the bar graph is useful
for making peak and null adjustments.
The bar graph is disabled when measuring capacitance. In
frequency, the bar graph and range annunciator indicate the
underlying voltage or current.
The number of segments indicates the measured value and is
relative to the full-scale value of the selected range, except on the
10 A ranges
.
In the 60 V range, for example (see below), the major divisions on
the scale represent 0, 30, and 60 V. An input of −30 V turns on
the negative sign and the segments up to the middle of the scale.
aej11f.eps
Cleaning
Wipe the case with a damp cloth and mild detergent. Do not use
abrasives or solvents. Dirt or moisture in the terminals can affect
readings.