


Using the Bar Graph
9
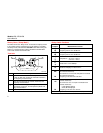
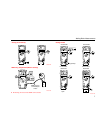
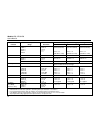
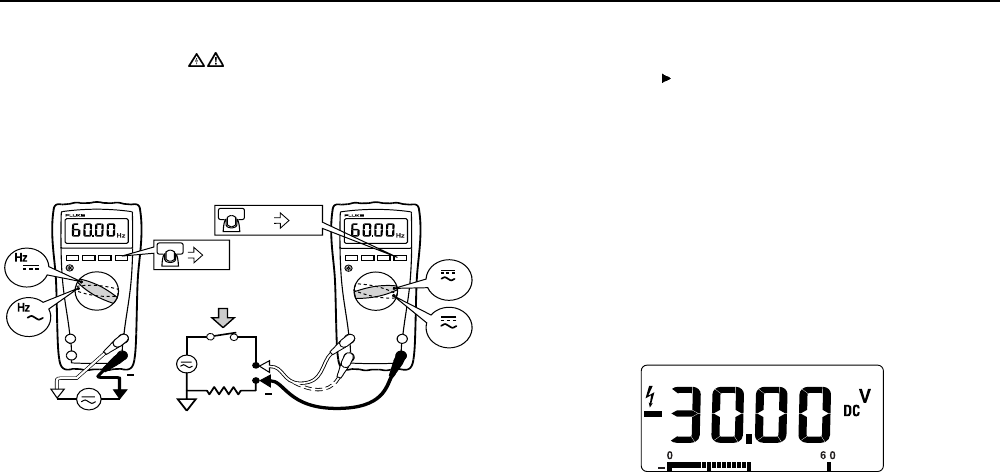
Measuring Frequency
Warning
To avoid electrical shock, disregard the bar graph for
frequencies > 1 kHz. If the frequency of the measured
signal is > 1 kHz, the bar graph is unspecified.
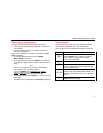
The Meter measures the frequency of a signal. The trigger level is
0 V, 0 A AC for all ranges.
+
RANGEHOLD
MIN MAX
Hz
RANGEHOLD
MIN MAX
V
V
AC/DC Voltage Frequency AC Current Frequency
Hzx 2
+
mA
A
AIK09F.EPS
⇒ To exit frequency, press YELLOW button or turn the rotary
switch.
⇒ In frequency, the bar graph shows the AC/DC voltage or AC
current accurately up to 1 kHz.
⇒ Select progressively lower ranges using manual ranging for a
stable reading.
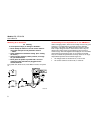
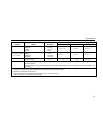
Using the Bar Graph
The bar graph is like the needle on an analog Meter. It has an
overload indicator (
) to the right and a polarity indicator (±) to the
left.
Because the bar graph updates about 40 times per second, which
is 10 times faster than the digital display, the bar graph is useful
for making peak and null adjustments and for observing rapidly
changing inputs.
The bar graph is disabled when measuring capacitance or
temperature. In frequency, the bar graph accurately indicates the
voltage or current up to 1 kHz.
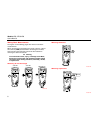
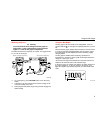
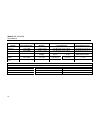
The number of lit segments indicates the measured value and is
relative to the full-scale value of the selected range
.
In the 60 V range, for example (see below), the major divisions on
the scale represent 0, 15, 30, 45, and 60 V. An input of −30 V
lights the negative sign and the segments up to the middle of the
scale.
AIK11F.EPS