Diagramming Scene Graphs
69
Diagramming Scene Graphs
Diagramming a scene graph is helpful in visualizing the structure of a Cosmo 3D
application. Figure 5-3 shows a diagram representing the scene graph coded in
Example 5-1.
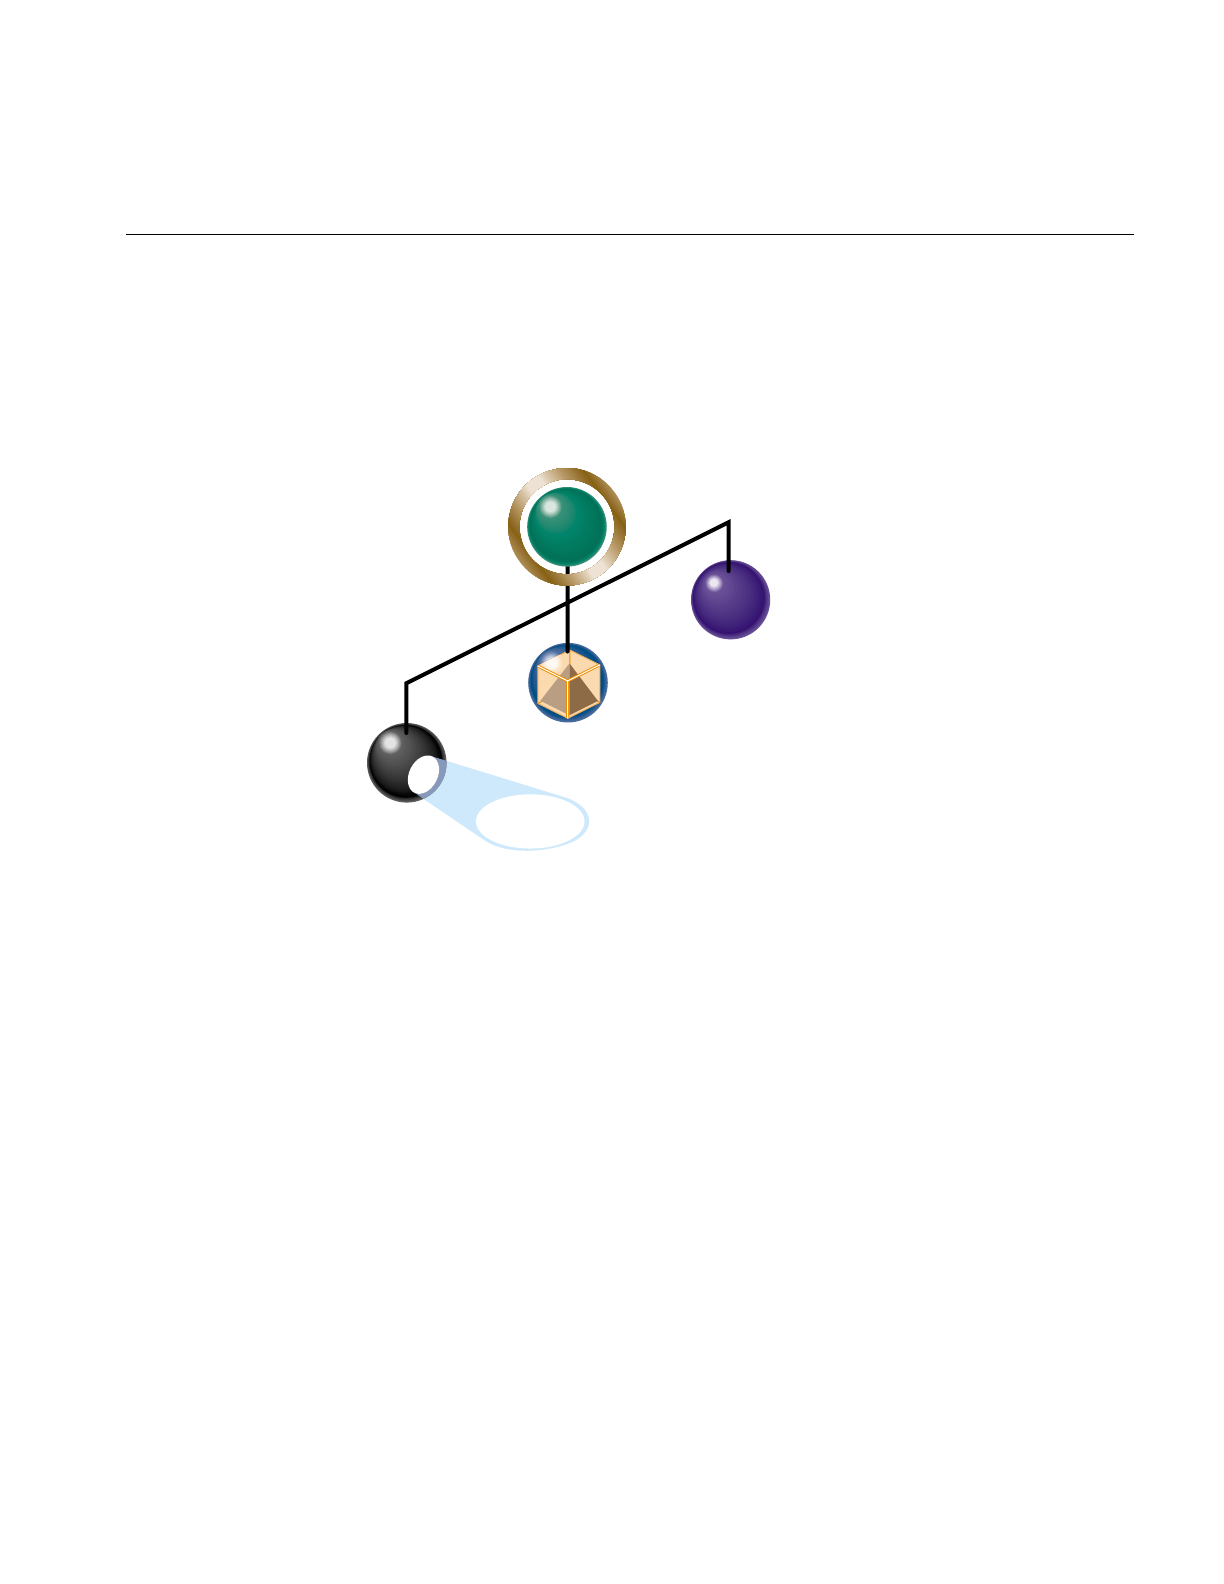
Figure 5-3 Simple Scene Graph
In diagrams of scene graphs, circles represent nodes and lines represent the node
hierarchy. The different types of circles represent the different types of nodes, for
example, root is a csGroup-type node whereas myShape is a csLeaf-type node. Notice
how the nodes are positioned: the three leaf nodes are children of the csGroup node and
the leaf nodes appear in the same order in which they were added to the root node in
Example 5-1. Remember, however, that actions may traverse these leaf nodes in any
order because these leaf nodes are at the same level.
Scene Graph Diagrams At A Glance
Diagrams of scene graphs provide an overview of the functionality of a Cosmo 3D
application without the bother of delving into the complexity of the code. A diagram of
a scene graph, for example, can show the number of data sets that can be rendered.
myLight
myShape
myFog
Root